MidScale Performance/Scalability test results
Here we describe the major tests that have been conducted during midScale project evaluation.
Component integration performance tests
The first kind of tests deals with the performance of midPoint on a small population of identities (users and their accounts).
They consist of automated runs of import and recomputation tasks, against a set of "dummy" source and target resources (DummyResource class). These resources execute in memory, so they are extremely fast.
Therefore, the execution times of import and recomputation tasks reflect the performance properties of midPoint itself, as they are not influenced by external factors - except for the performance of the database used to host midPoint repository.
MidPoint is run on a single node, i.e. not in a clustered environment. The execution itself takes part within Maven Failsafe Plugin in the Jenkins environment. The specific test class being used is TestSystemPerformance. Detailed description of the test is available in a separate document.
In midScale, the tests consisted of running import and recomputation tasks, measuring the time \$T\$ they needed to process specified number \$N\$ of accounts or users, and determining the average time to process single account/user (i.e. \$\frac{T}{N}\$) and the throughput (per minute), i.e. \$\frac{N}{T} * 60,000\$.
In general, the performance of midPoint strongly depends on specific circumstances, like the number of source and target resources,
the number and complexity of mappings, the characteristics of data being processed (e.g. the typical number of values per item),
and so on. Therefore, we have prepared a set of different scenarios and evaluated the performance for each of them.
The naming of the scenarios reflects their basic characteristics. As an example, let us describe the meaning of 3s-50m-3t-50m-50a-1500u:
| Sign | Meaning | Example | Explanation |
|---|---|---|---|
|
Number of source resources |
|
three source resources |
|
Number of mappings |
|
50 mappings for single-valued items plus 50 mappings for multi-valued items (100 in total). There are two values of this parameter: one for source resources (i.e. inbound mappings) and one for target resources (i.e. outbound mappings). |
|
Number of target resources |
|
three target resources |
|
Number of assignments per user |
|
each user has 50 direct assignments |
|
Number of users (source accounts) in the test |
|
1500 users (accounts) |
There are other parameters, not represented in the scenario names by default. In the table below we summarize the key ones. (We still leave out unimportant parameters, like the number of import no-op runs, or reconciliation runs, which were zero in all the tests.)
| Parameter | Meaning | 1s-50m-0t-0m-0a-10ku | 1s-200m-0t-0m-0a-10ku | 1s-50m-5t-50m-0a-5ku | 1s-50m-5t-50m-100a-1ku | 3s-50m-3t-50m-50a-1500u |
|---|---|---|---|---|---|---|
|
Number of single valued extension properties |
50 |
200 |
50 |
50 |
50 |
|
Number of single valued extension properties |
50 |
200 |
50 |
50 |
50 |
|
Percentage of properties that should be indexed |
0 |
0 |
0 |
0 |
0 |
|
Number of source resources |
1 |
1 |
1 |
1 |
3 |
|
Number of accounts on each resource. (This corresponds to the number of imported midPoint users.) |
10,000 |
10,000 |
5,000 |
1,000 |
1,500 |
|
Number of inbound mappings for single-valued dummy attributes → properties |
50 |
200 |
50 |
50 |
50 |
|
Number of inbound mappings for multi-valued dummy attributes → properties |
50 |
200 |
50 |
50 |
50 |
|
Number of values for each multi-valued dummy attribute |
5 |
5 |
5 |
5 |
5 |
|
Number of target resources |
0 |
0 |
5 |
5 |
3 |
|
Number of outbound mappings for single-valued dummy properties → attributes |
0 |
0 |
50 |
50 |
50 |
|
Number of outbound mappings for multi-valued dummy properties → attributes |
0 |
0 |
50 |
50 |
50 |
|
Number of generated business roles |
0 |
0 |
0 |
100 |
100 |
|
Number of generated technical roles |
0 |
0 |
0 |
500 |
500 |
|
Number of business role assignments per user |
0 |
0 |
0 |
100 |
50 |
|
Number of business → technical role inducements per business role |
0 |
0 |
0 |
2 |
2 |
|
Number of worker threads for the import tasks |
31 |
31 |
31 |
31 |
31 |
|
Number of worker threads for the recomputation task |
31 |
31 |
31 |
31 |
31 |
The detailed explanation of these parameters can be found in the test description mentioned above.
Versions of midPoint that have been used in the tests:
| Label | Commit ID |
|---|---|
4.2 (before) |
|
4.4 (after) |
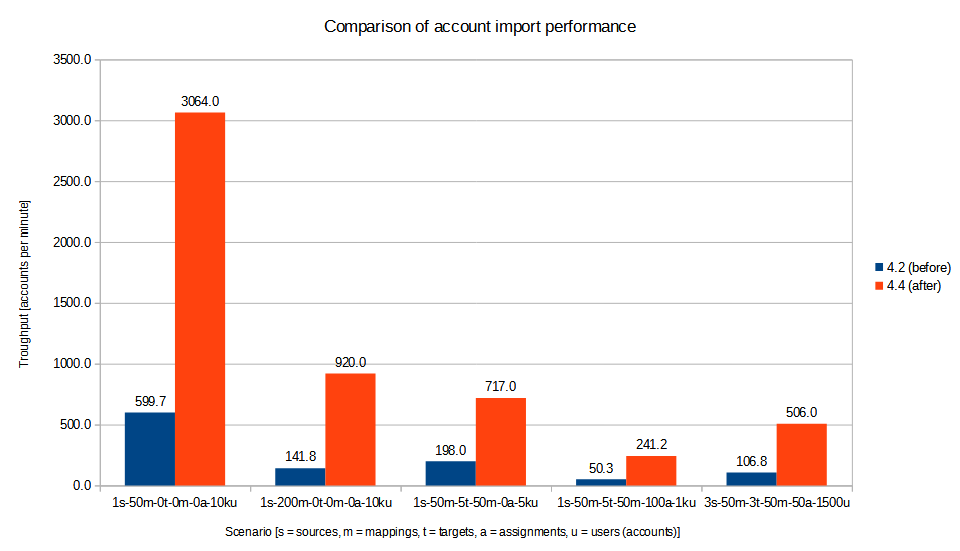
The tests were executed in our testing environment consisting of a two-node Kubernetes cluster. There results were the following:
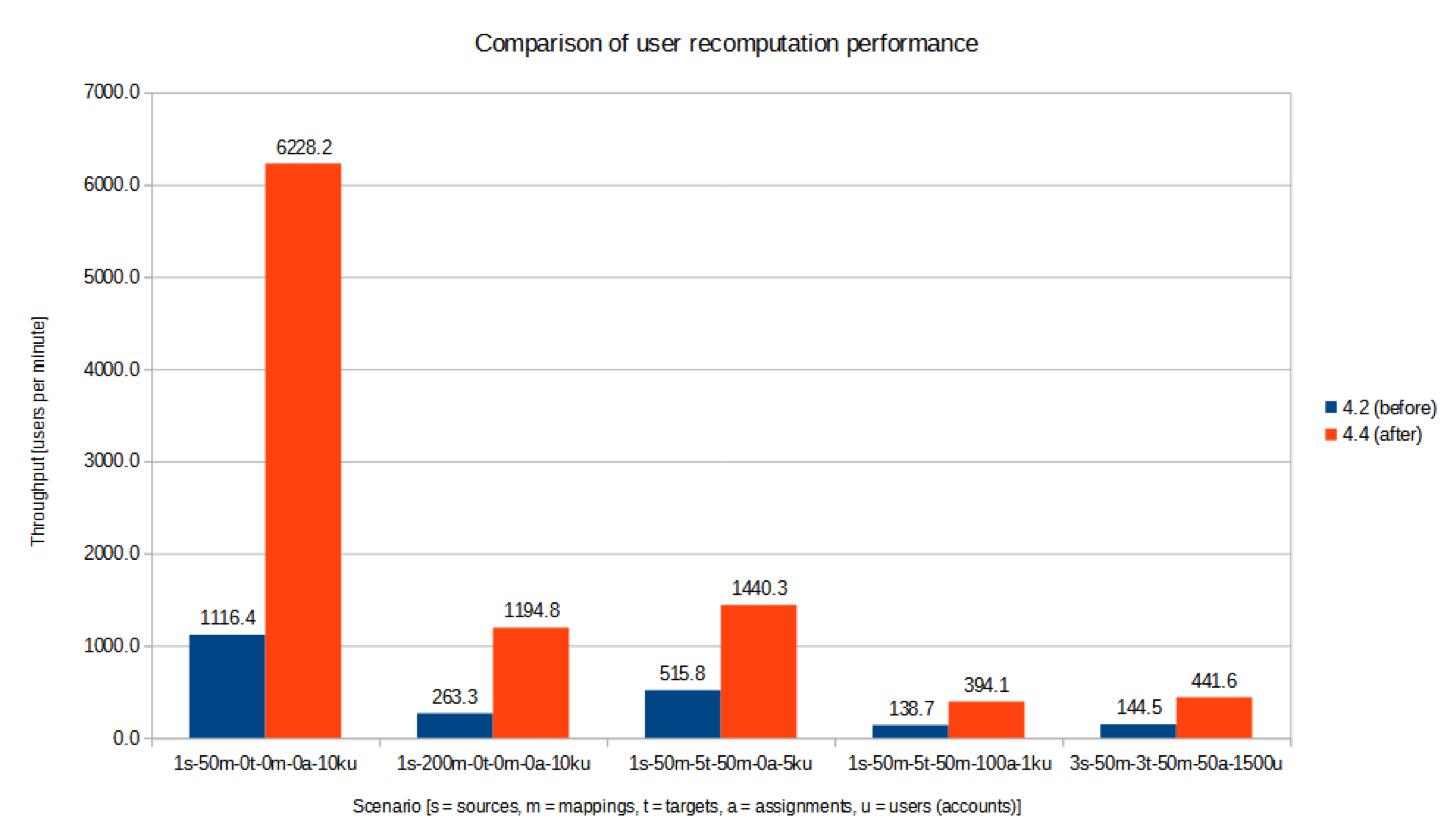
We can see a significant improvement of midPoint performance in all the mentioned scenarios.
UI performance tests
During the midScale we also invested a time to prepare automated (wicket-based) GUI tests. The aim of the tests is to do basic measurements for page rendering as well as monitoring executed queries and their count. In past there had been places in GUI implementation with non-optional calls for repository, e.g. requesting to load an object many times even when once was enough. We use GUI (wicket-based) tests to monitor and prevent such non-optimal behavior.
Tests have been executed in the testing environment build up during midScale project. The data were generated based on the previous requirements and hurdles, such as slow loading of user details page when there was a lot of extension attributes defined, slow loading of user’s assignment, when a user had a lot of assignments, etc. According to these issues we prepared the testing environment, in total there is up to 5000 users, up to 1000 organizations, 5000 roles and 5000 services, 120 extension attributes of different types defined for users, around 50 assignments per user.
The tests resuls are as follows:
-
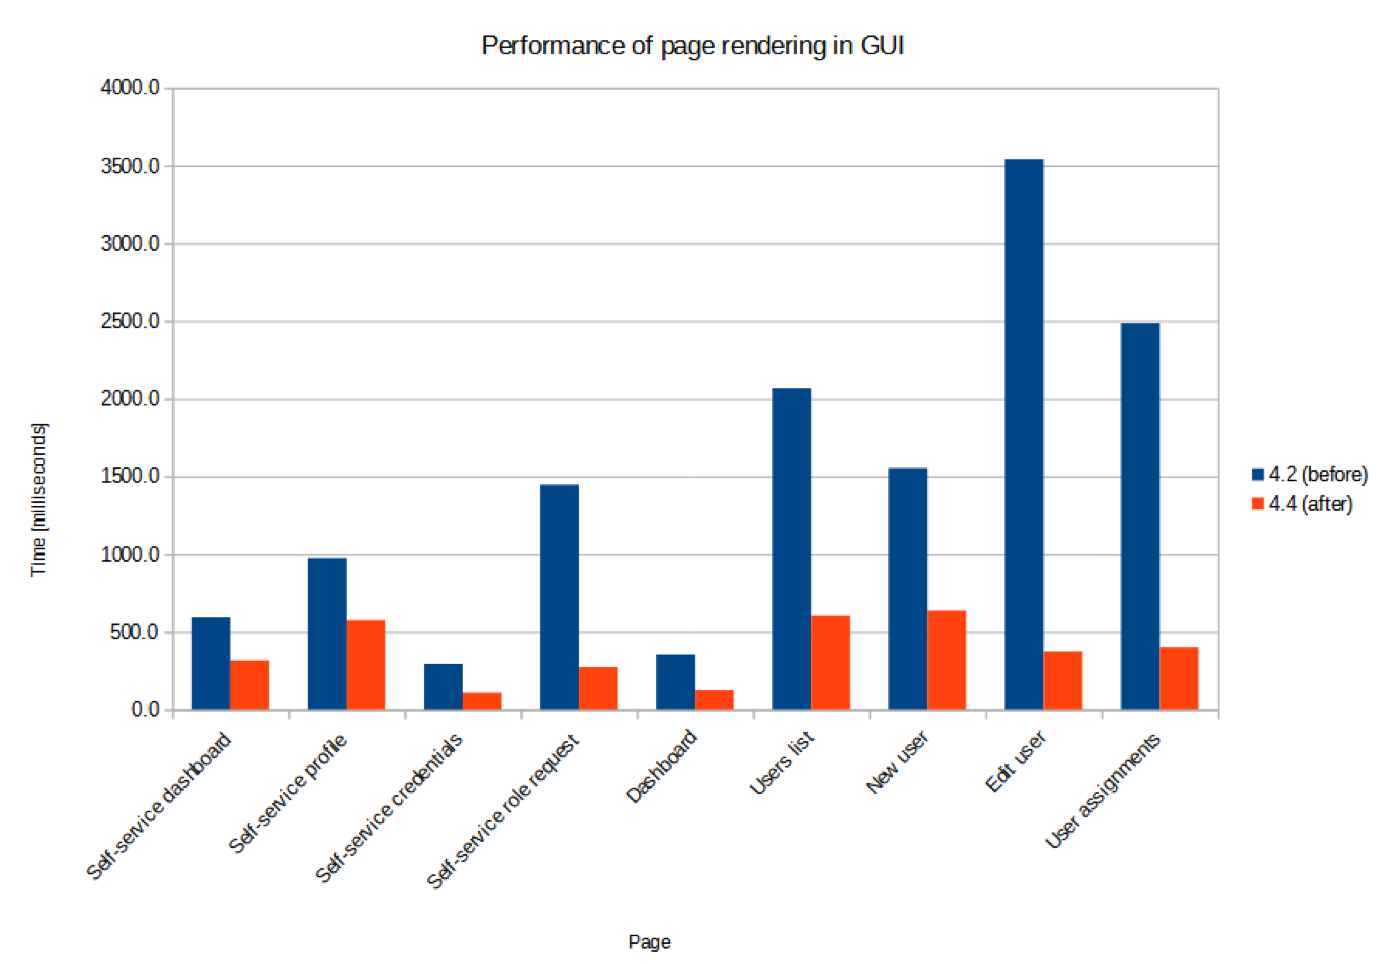
Performance test - measuring how long it takes to display specific page
-
Executed queries - how many queries had to be executed to render a page
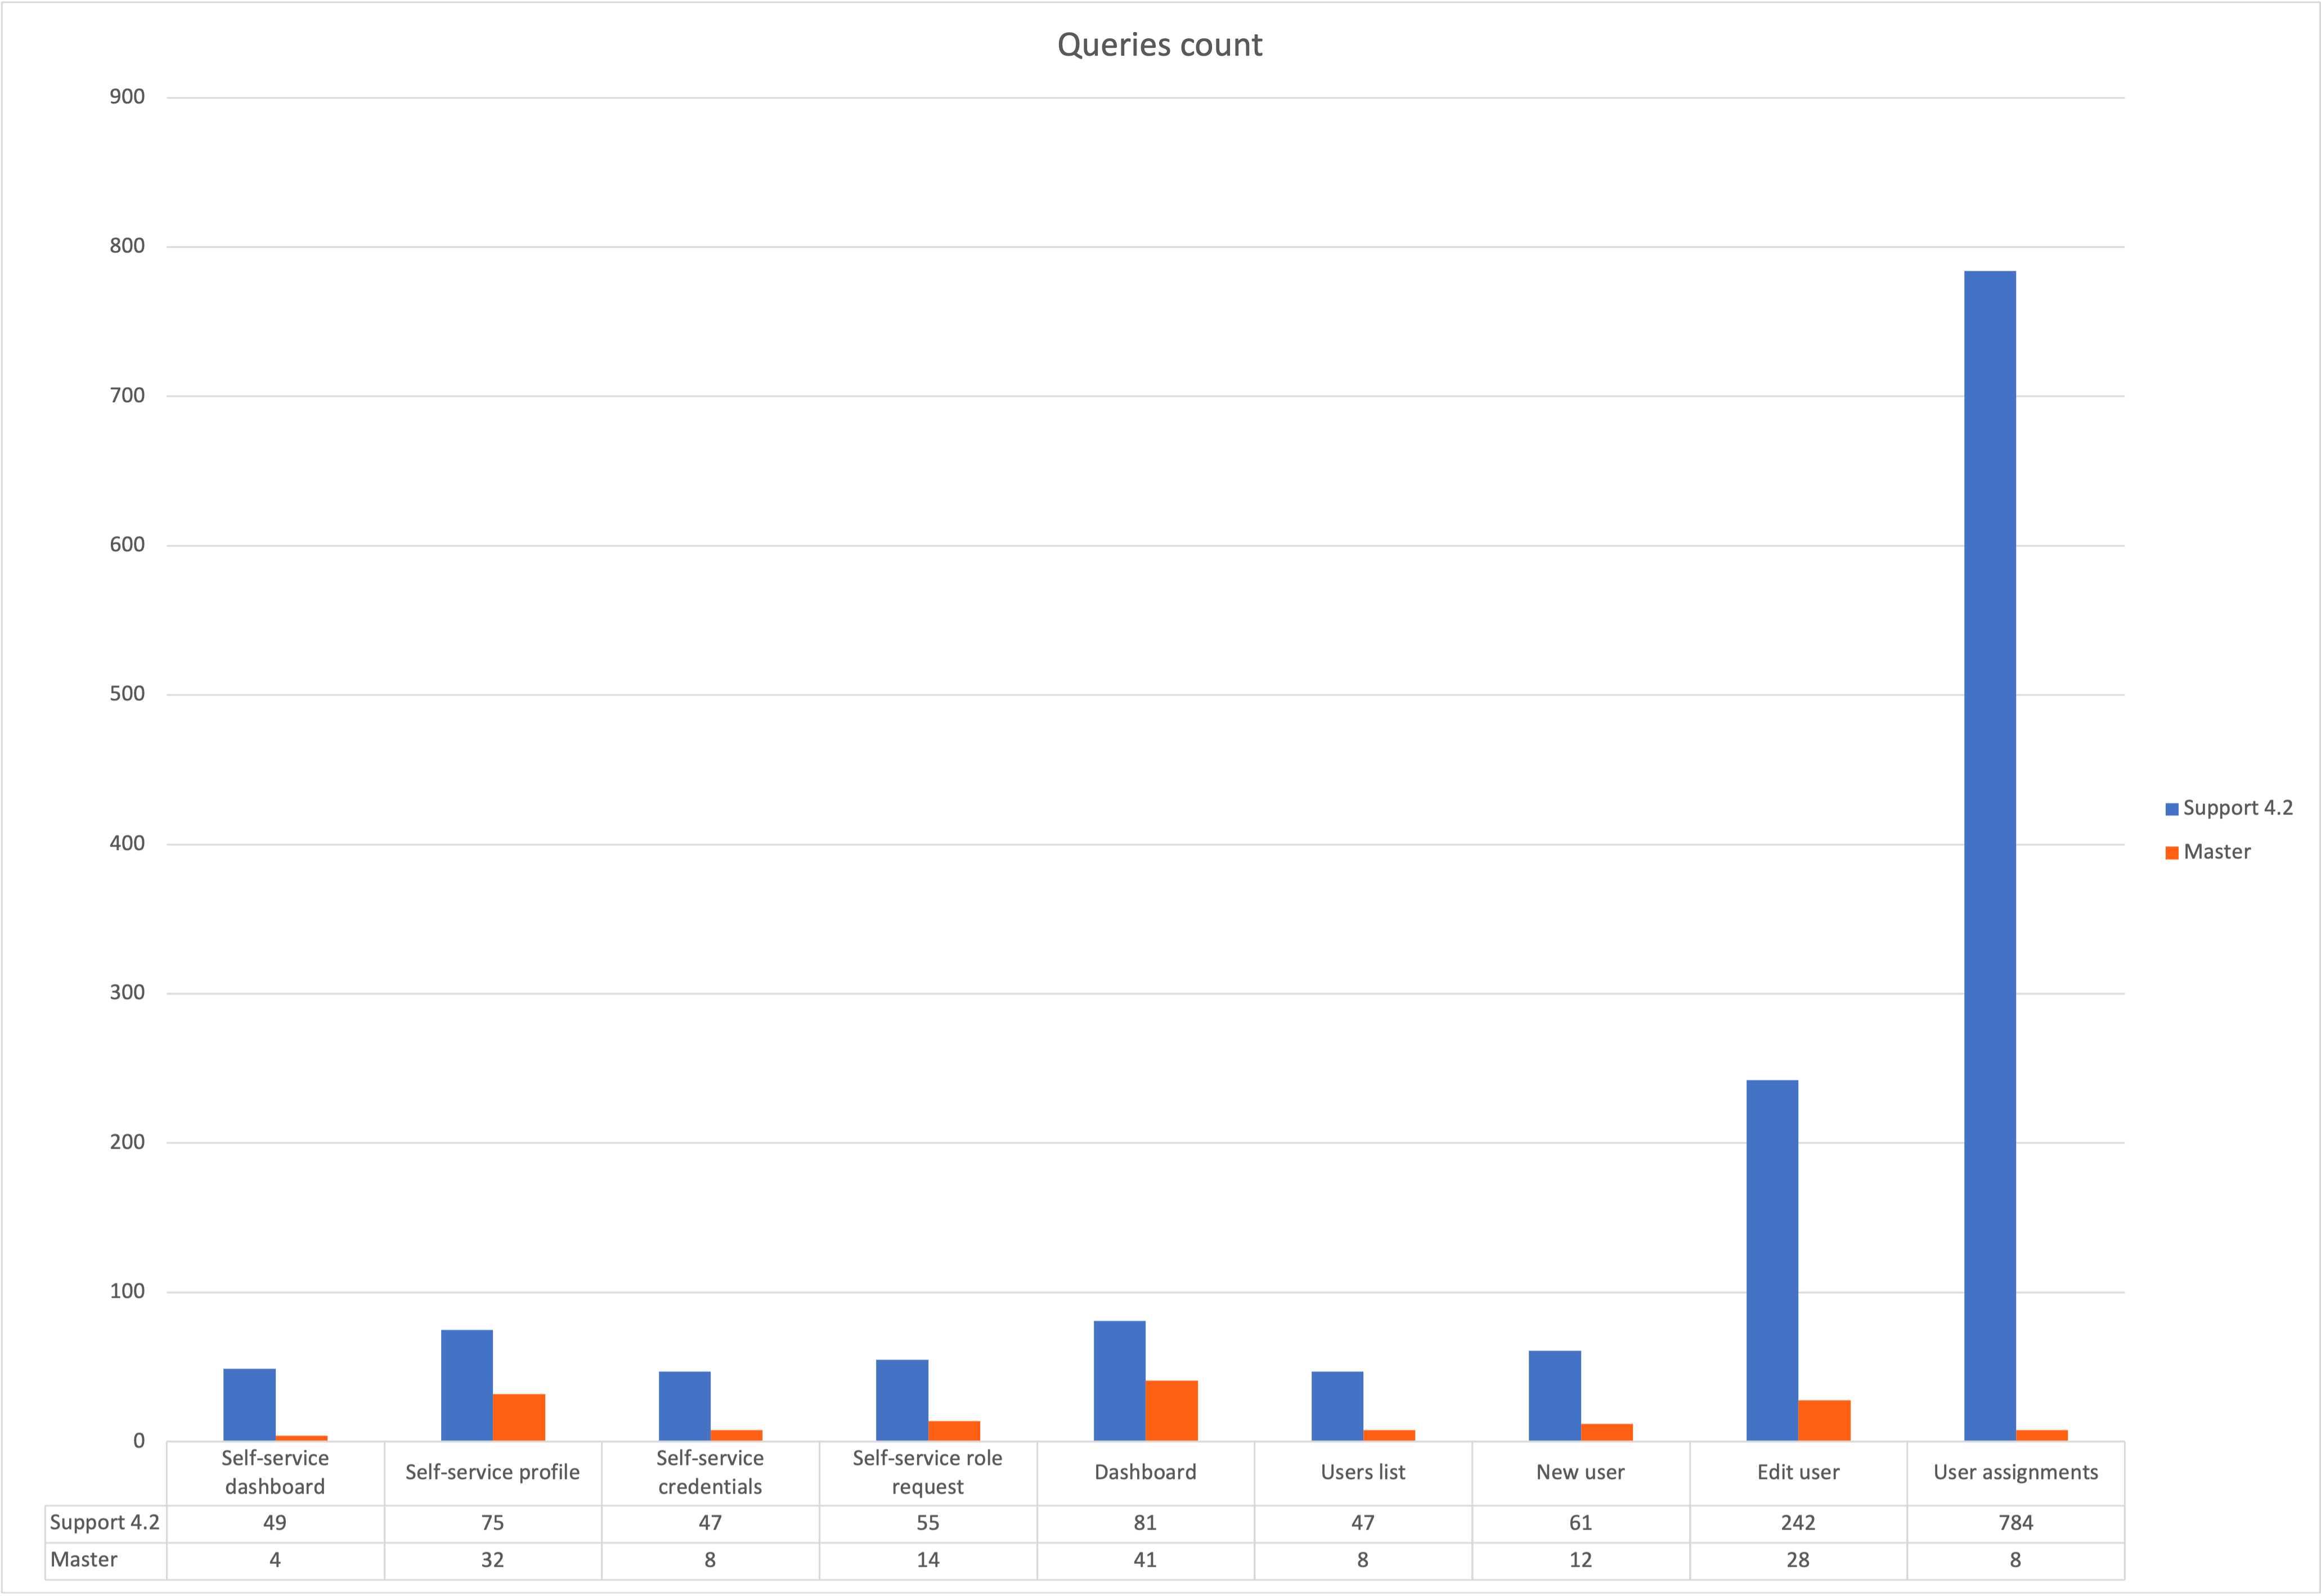
According to the test results it can be seen, that different improvements were made and a lot of places were optimized. The most notable improvements as visible also in the pictures are related to the showing user’s details and user’s assignments.
UI feature tests a.k.a. Schrodinger tests
Schrodinger tests are intended to support the stability of midPoint user interface. In condition of the permanent project development and improvement, it is very important to be sure that user interface is still stable and respondent. Schrodinger tests cover the most common user use cases, also cover midPoint fundamental training labs and partially midPoint advanced training labs. This kind of testing can be applied to several midPoint deployments with different configured test environments.
All tests are grouped into several profiles: those which don’t require any preparation (e.g. there is no need in post-initial object import or in schema extension) are gathered in profile with id configless; those which require more complex before-testing-preparation are gathered in fundamental-labs and advanced-labs profiles (according to the type of the training). There is also a possibility to run all-tests profile (all tests will be run).
Schrodinger framework was improved within midScale project to fulfill the following requirements:
-
the fluency of the test code. This means that Schrodinger framework already wraps the concrete user actions into methods so that to write a new test the tester needs just to call the appropriate methods one by one.
-
speeding up the initialization process of midPoint and the tests running. Another midPoint service (rest-prism client) is used to add objects to midPoint (instead of using the Import page in midPoint).
-
extended variety of test environments. New possible test environments can be configured thanks to such properties as startMidpoint (true in case if you want to start midPoint before starting the tests; false in case if midPoint instance is already running), useRemoteWebdriver (the flag to use local or remote web driver).
-
informative and understandable tests results. All assertion methods were extended with a screenshot to make the test failure more clear. Logging the time of actions in GUI part can fill out the information about midPoing performance.
More detailed information about Schrodinger framework can be found by link Schrodinger Testing Framework.
The Kubernetes pods were used:
| Pod name | Description |
|---|---|
schrodinger-dynamic |
Starting midPoint before tests, initializing midPoint with all necessary objects and running the tests then. Local web driver is used. Due to continuous development process test results can vary and new failure can appear. |
schrodinger-dynamic-localDriver-remote_mp |
MidPoint is already started and prepared (e.g. extension schema is already added) before Schrodinger tests running. Local web driver is used. Due to continuous development process test results can vary and new failure can appear. |
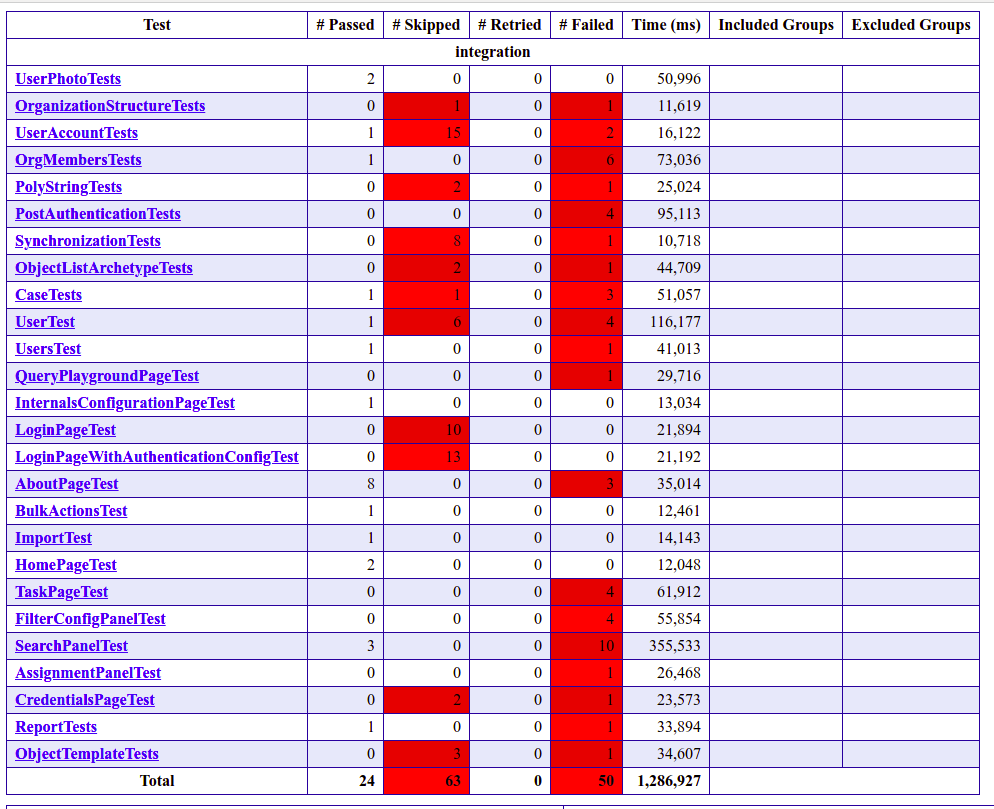
Results of the Schrodinger tests under schrodinger-dynamic-localDriver-remote_mp job:
End-to-end performance tests
The goal of these tests is to determine the scalability of midPoint regarding the size of user population (i.e. number of identities being managed).
They consist of a simulated HR resource (having a defined number of user accounts, organizations, organization units, groups, and user-group membership relations), midPoint cluster, and eight target resources. All these components execute in our two-node Kubernetes testing environment.
We run the tests in four stages, described separately.
Stage 1: Pure import
The first stage consisted of a pure import, i.e. importing HR accounts without doing provisioning to the targets.
We have run the following scenarios:
| Internal ID | ID | Description | git commit ID |
|---|---|---|---|
|
4.4 (after) |
The current version of midPoint |
|
|
4.2 (before) |
Version 4.2 (state as of Aug 9, 2021) |
|
|
4.2 (no shadow cache) |
Version 4.2 (state as of Aug 9, 2021), with disabled un-scalable functionality (see below). |
The Kubernetes pods used:
| Pod name | Description |
|---|---|
|
PostgreSQL database with a simulated HR resource. Sizing: 1 million accounts, 100,000 organization units, 100,000 groups, but minimal number of account-group relations. |
|
PostgreSQL database for midPoint repository for scenario X. (X = 1, 4, 6) |
|
Application server number Y for midPoint for scenario X. (Y = 0, 1) |
The containers had unlimited resources (RAM, CPUs) available. However, we set Java parameters
for midPoint application servers heap to 20 GB max (-Xmx20480m).
Parameters of the import tasks used:
| Parameter | Value |
|---|---|
Worker tasks |
2 worker tasks per each midPoint node, i.e. 4 worker tasks overall |
Worker threads |
8 threads per each worker task, i.e. 32 worker threads overall |
Bucket size |
5,000 accounts |
The overall performance:
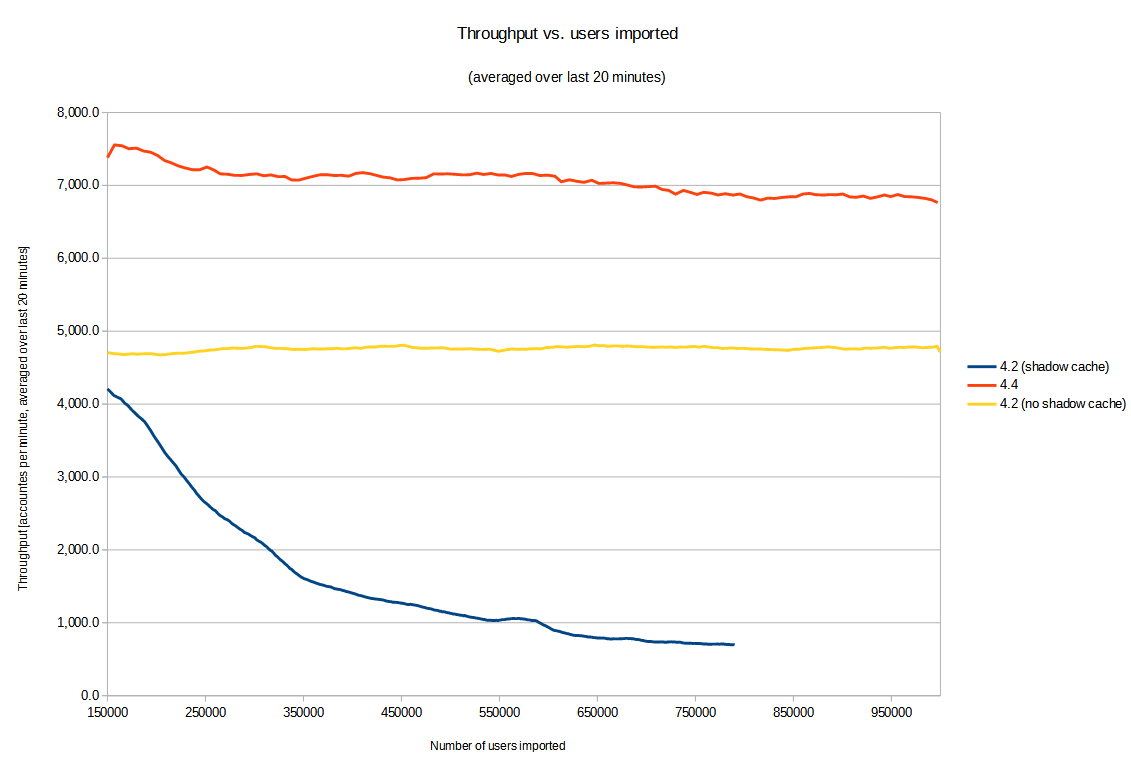
Comments: The sharply decreasing performance of "4.2 (before)" was identified to be due to a bug MID-6245 that was fixed during development of midPoint 4.4. (Although we originally didn’t expect it would have such a detrimental effect on the scalability!) To allow a fair comparison of 4.2 and 4.4 we have modified the configuration used in the test to avoid large-scale use of the query cache: turned it off for shadow objects. This is indicated by "4.2 (no shadow cache)" scenario, plotted as yellow line in the chart above. In this particular test the slowdown with shadow cache turned off was not significant. But generally, the cache is a key component regarding the performance, so disabling it may slow the performance down significantly in real-world operation.
The performance was determined by periodical sampling of the import task (once per minute), and measuring how many accounts were imported during that time, and how many users were already in the repository. (Besides users, there was an equal number of shadows: each user had one corresponding HR shadow.) The performance was averaged over last 20 minutes, in order to show the trends more clearly by avoiding fluctuations stemming e.g. from the processing across buckets boundaries, and random deviations.
Stage 2: Import with provisioning
For this test, we have excluded the original 4.2 scenario (i.e. the one with the shadow cache enabled), because there was no point in testing it for larger numbers of objects. On the other hand, we have added 8 target resources: 7 of them using simple DBTable connector, and the one with advanced ScriptedSQL connector. The latter one was used because we wanted to check also the performance of provisioning accounts with entitlements (group membership).
So, the scenarios were:
| Internal ID | ID | Description | git commit ID |
|---|---|---|---|
|
4.4 (after) |
The current version of midPoint |
|
|
4.2 (no shadow cache) |
Version 4.2 (state as of Aug 9, 2021) |
The Kubernetes pods used:
| Pod name | Description |
|---|---|
|
PostgreSQL database with a simulated HR resource. Sizing: 10 million accounts, 5,000 organization units, 5,000 groups, 20 million account-group membership relations (two groups per a user in average). |
|
PostgreSQL database for midPoint repository for scenario X. (X = 1, 2) |
|
Application server number Y for midPoint for scenario X. (Y = 0, 1) |
|
PostgreSQL database hosting the tables for 8 target resources. |
We have restricted the resources available to midPoint repositories (perf-test-X-repo pods)
to 8 GB of RAM and 6 virtual CPUs. The reason was that in stage 1 executions the servers - being not limited - acquired
approximately 60 GB of RAM (out of 192 GB available on each Kubernetes node). We wanted to know how they would behave
in a more realistic setting. The Java parameters for midPoint application servers were kept without change - 20 GB heap max.
Parameters of the import tasks used:
| Parameter | Value |
|---|---|
Worker tasks |
2 worker tasks per each midPoint node, i.e. 4 worker tasks overall |
Worker threads |
12 threads per each worker task, i.e. 48 worker threads overall |
Bucket size |
5,000 accounts |
(We have added worker threads because now there’s more processing related to any single account being imported.)
Both versions of midPoint did scale well in this scenario, as can be seen in the chart below.
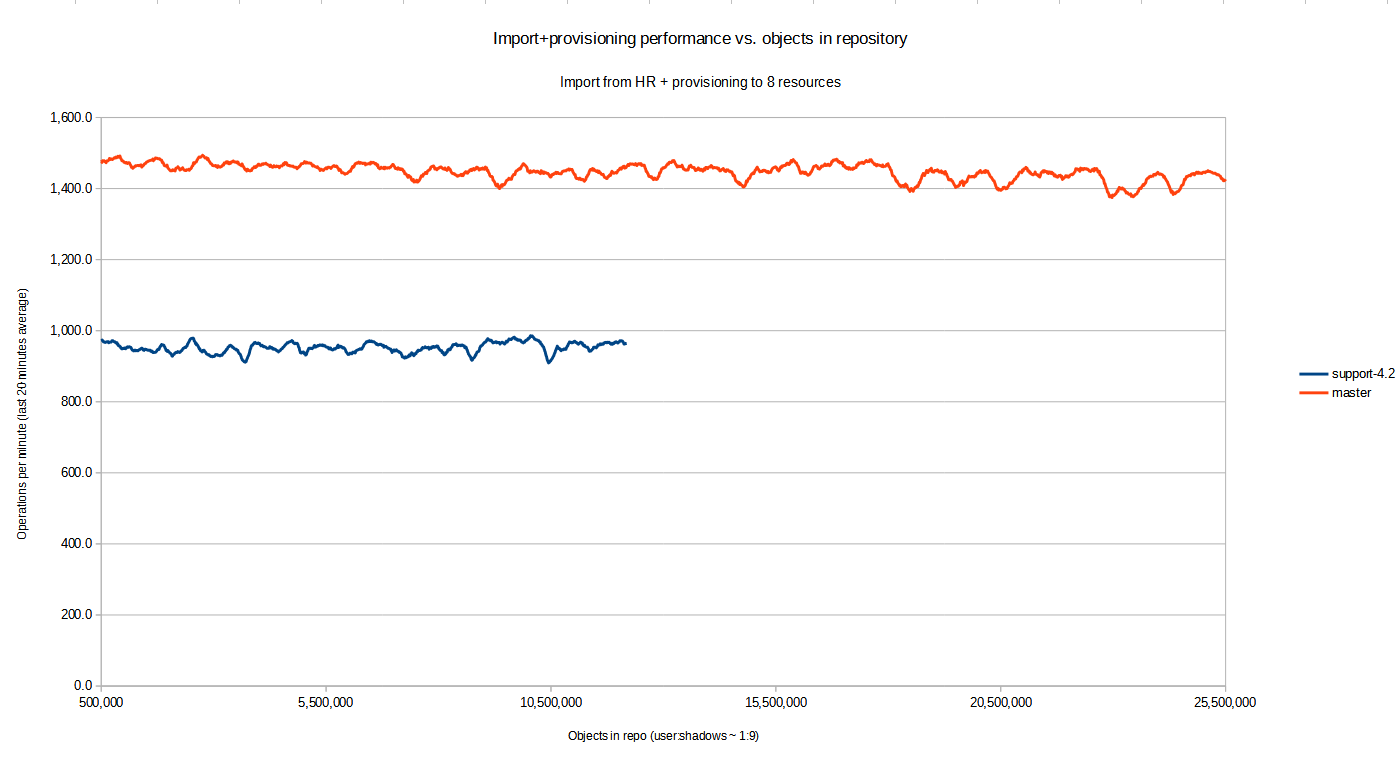
Note that x-axis shows the approximate number of objects in repository. This number consists primarily of users and their shadows: for each user there are 9 shadows (HR + 8 targets). The y-axis is the actual performance at given moment in time, averaged over last 20 minutes.
Stage 3: Executing Validity scanner queries
Finally, after reaching approximately 3.16 million users (for 4.4) and 1.61 million users (for 4.2) we decided to move into a higher gear and boost the numbers of users and assignments by injecting them directly into the repository - i.e. without going through the full process of import from a resource. (The full process includes e.g. projection computations, auditing, provisioning to target resources, and so on. Simply adding objects to the repository is much faster.)
So, we increased the user population to approximately 20 million, and tried to execute the queries that were known to be problematic in older midPoint versions. In particular, we run the queries used by the Validity scanner task. To be able to see the difference between 4.2 and 4.4 more clearly, we executed the queries both on fast SSD disks and slower HDD ones.
The results were the following:
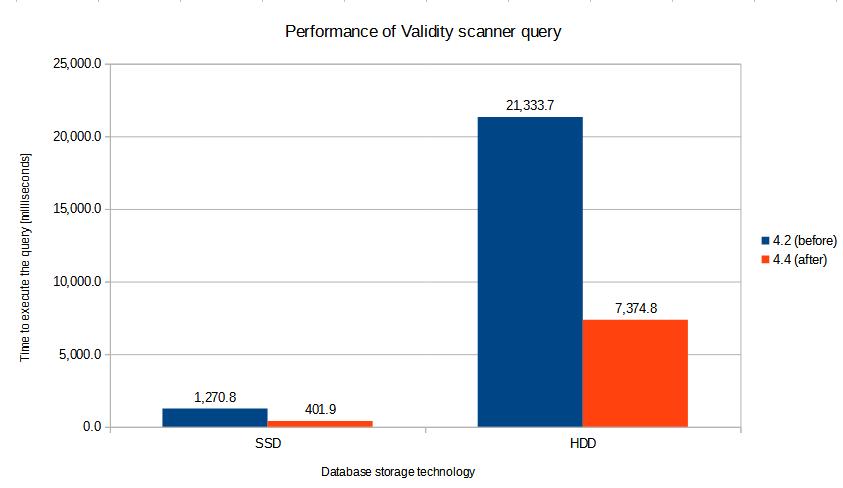
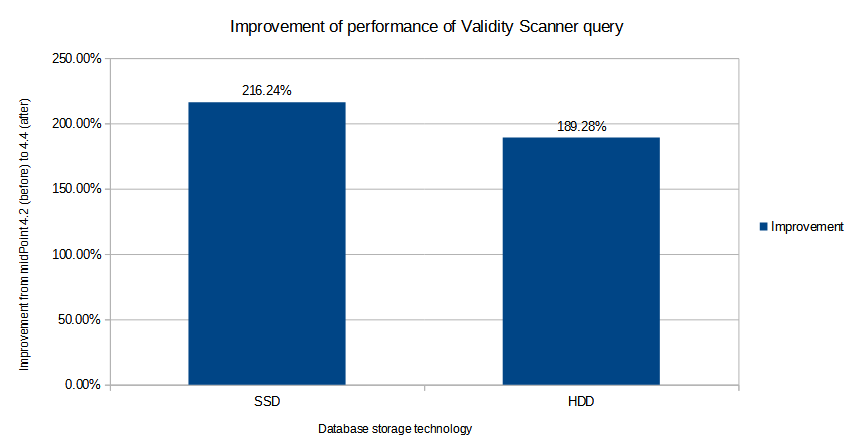
The results show (approximately) threefold performance improvement (by ~ 200%) from 4.2 to 4.4.
Stage 4: Continuing with HR import task
The HR import task was left running. Eventually it processed all 10 million accounts with the average throughput of 1,300.9 accounts per minute. The performance varied with the number of repository objects like this:
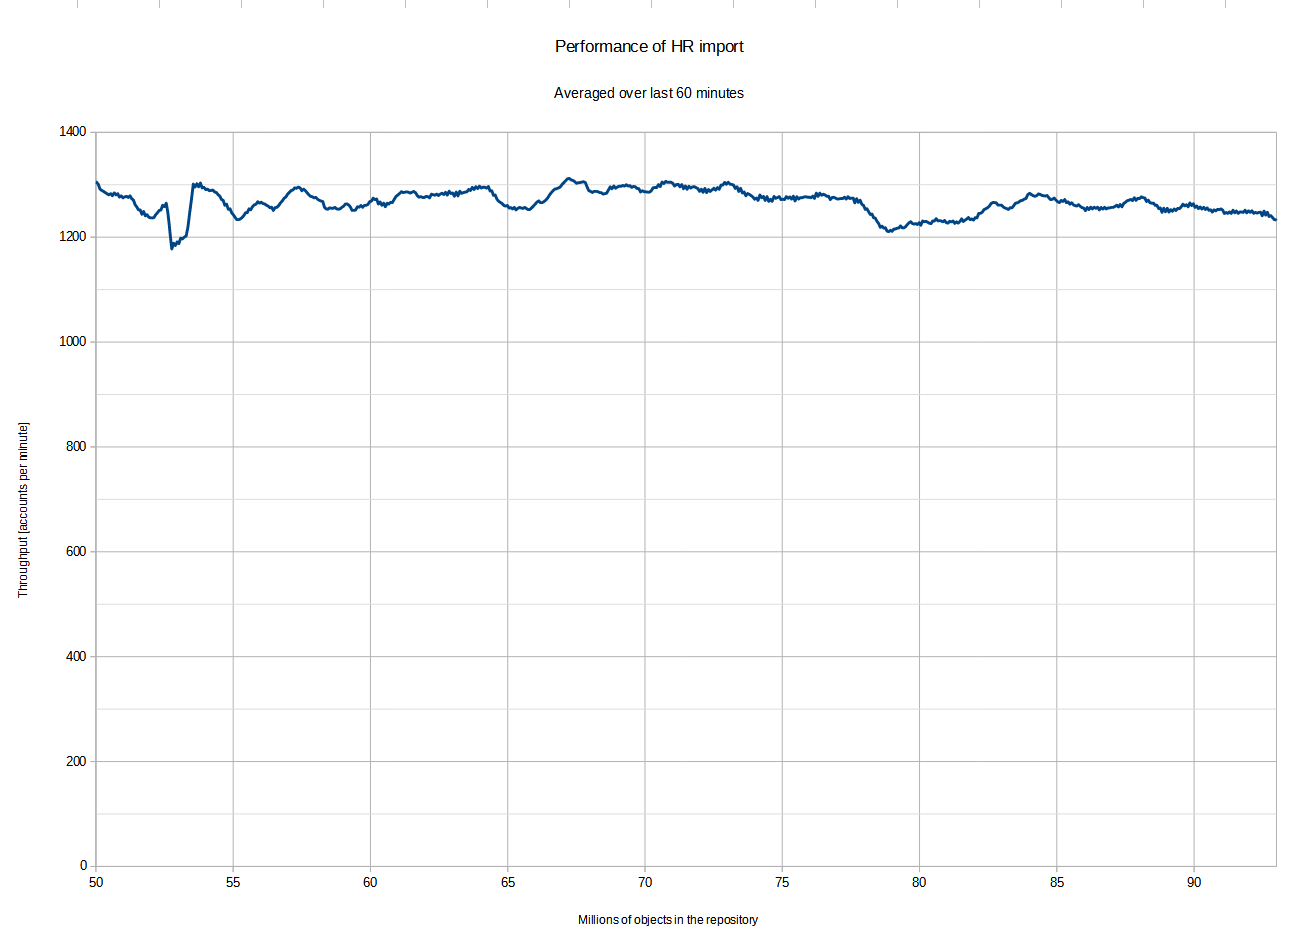
(The sampling process stopped at approximately 75% of the processing because of the lack of disk space in the monitoring pod. Nevertheless, we can safely assume that the performance did not decrease after that point, because the overall throughput measured by midPoint itself - 1,300 per minute - corresponds to the values presented in the graph.)
Other performance tests
Was this page helpful?
YES
NO
Thanks for your feedback