<objectCollection oid="72b1f98e-f587-4b9f-b92b-72e251dbb244">
    <name>Account shadow R1</name>
    <type>ShadowType</type>
    <filter>
        <and>
            <ref>
                <path>resourceRef</path>
                <value oid="---RESOURCE_OID---"/>
            </ref>
            <equal>
                <path>kind</path>
                <value>account</value>
            </equal>
        </and>
    </filter>
</objectCollection>Example of Dashboard report: Shadows on resource
Please see Dashboard configuration for basic information about configuration variables.
Usecase
Administrator needs display all shadows on resource with actual state.
Configuration
As first we need configure object collection for shadows of concrete resource and kind.
Object collection
Please replace_ '---RESOURCE_OID---_' with oid of your resource.
When we have object collection, then import Dashboard object with widget for our object collection.
Dashboard
<dashboard oid="72b1f98e-f587-4b9f-b92b-72e251da1234">
    <name>shadow-dashboard</name>
    <display>
        <label>Shadow dashboard</label>
    </display>
    <widget>
        <identifier>shadow</identifier>
        <display>
            <label>Resource R1; ACCOUNT</label>
            <color>#00a65a</color>
            <icon>
                <cssClass>fa fa-user</cssClass>
            </icon>
        </display>
        <data>
            <sourceType>objectCollection</sourceType>
            <collection>
                <collectionRef oid="72b1f98e-f587-4b9f-b92b-72e251dbb244" type="ObjectCollectionType"/>
            </collection>
        </data>
        <presentation>
            <dataField>
                <fieldType>value</fieldType>
                <expression>
                    <proportional>
                        <style>value-only</style>
                    </proportional>
                </expression>
            </dataField>
            <dataField>
                <fieldType>unit</fieldType>
                <expression>
                    <value>shadows</value>
                </expression>
            </dataField>
            <view>
                <column>
                    <name>nameColumn</name>
                    <path>name</path>
                    <display>
                        <label>Name</label>
                    </display>
                </column>
                <column>
                    <name>kindColumn</name>
                    <path>intent</path>
                    <display>
                        <label>Kind</label>
                    </display>
                    <previousColumn>nameColumn</previousColumn>
                </column>
                <column>
                    <name>intentColumn</name>
                    <path>kind</path>
                    <display>
                        <label>Intent</label>
                    </display>
                    <previousColumn>kindColumn</previousColumn>
                </column>
                <column>
                    <name>synchronizationColumn</name>
                    <path>synchronizationSituation</path>
                    <display>
                        <label>Synchronization</label>
                    </display>
                    <previousColumn>intentColumn</previousColumn>
                </column>
            </view>
        </presentation>
    </widget>
</dashboard>
After successful import of dashboard object and reload of page you can see dashboard in menu Dashboards > Shadow dashboard.
We want report with table of shadow, so we import dashboard report.
Report
<report>
<name>Shadow dashboard report</name>
<reportEngine>dashboard</reportEngine>
<dashboard>
<dashboardRef oid="72b1f98e-f587-4b9f-b92b-72e251da1234" type="DashboardType"/>
</dashboard>
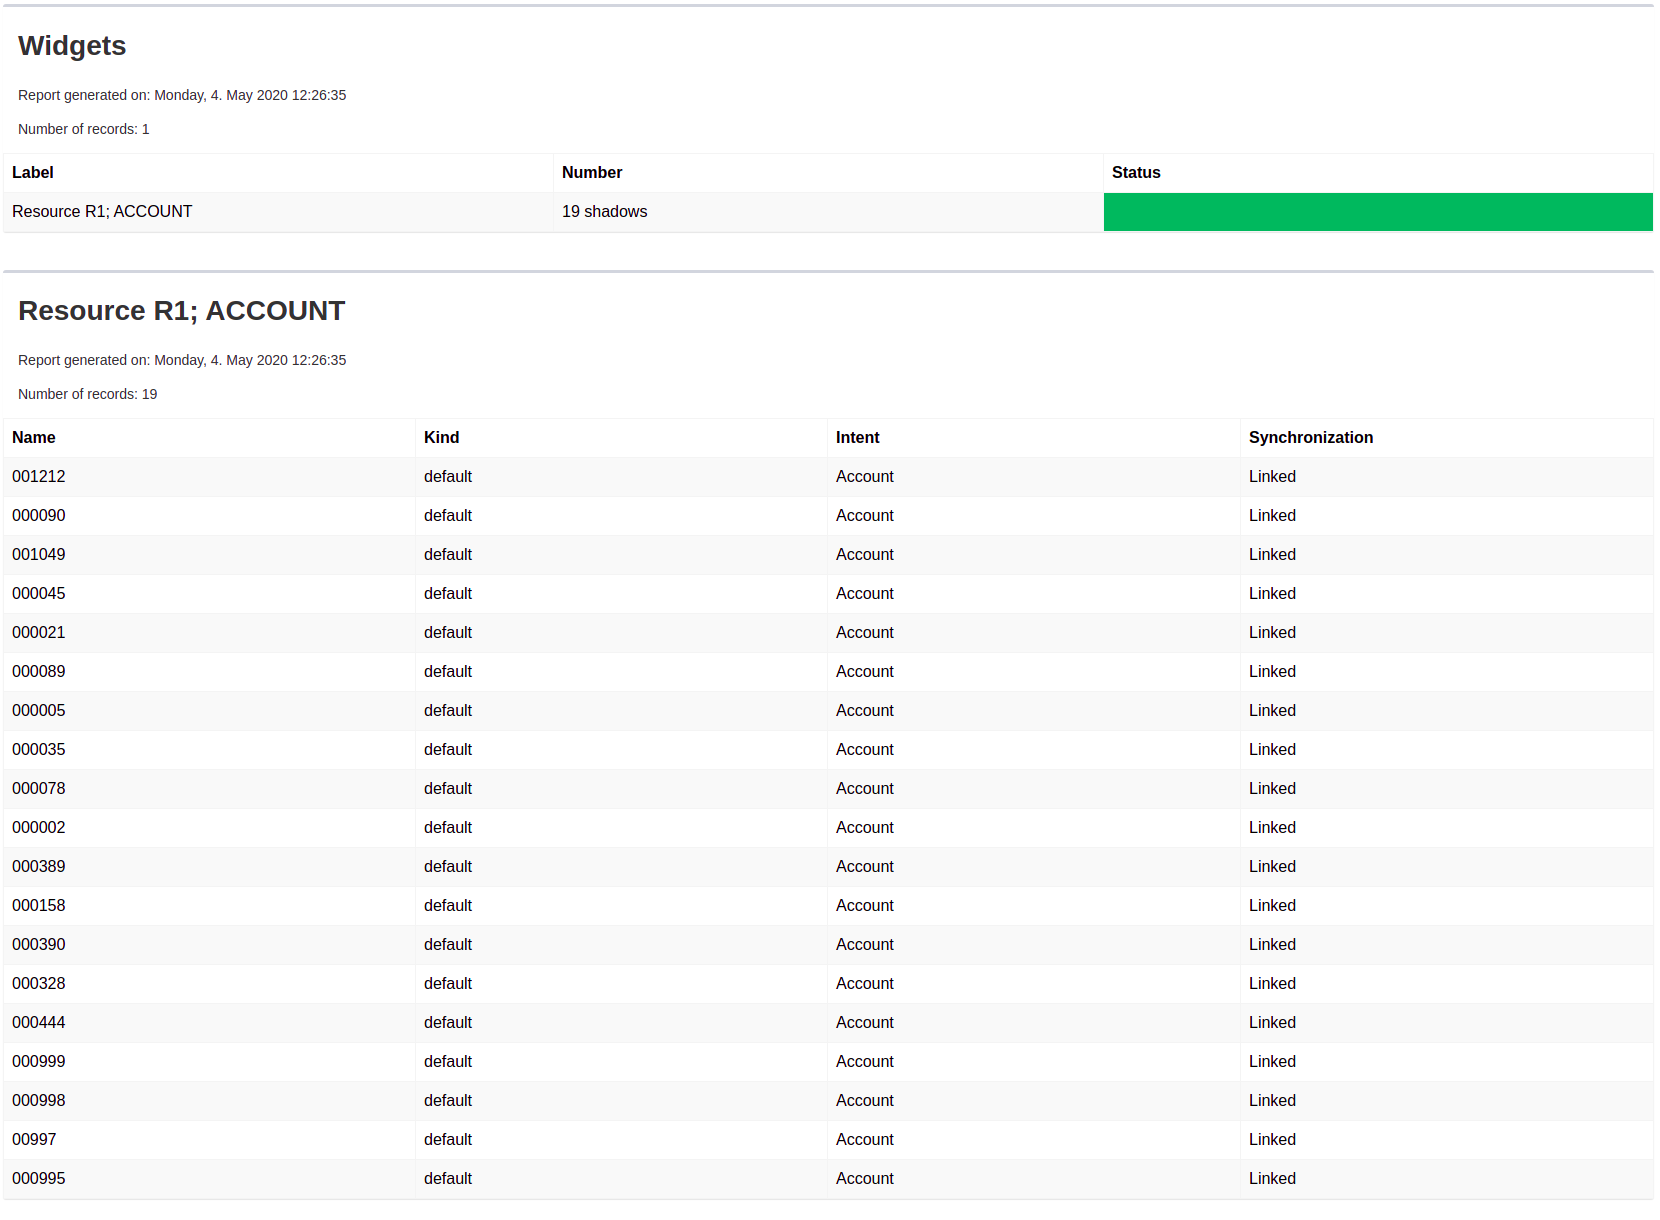
</report>Now we can run report in report menu, show task, and download report. Every report from dashboard is in HTML format.
Report:
Was this page helpful?
YES
NO
Thanks for your feedback